Fully diluted valuation (FDV) is the theoretical market cap of a cryptocurrency if every token that will ever exist were already in circulation at the current price. FDV reveals how much future dilution awaits token holders. Comparing FDV to current market cap exposes whether a token’s valuation is sustainable or inflated by restricted supply.
In This Article
How Is Fully Diluted Valuation Calculated?
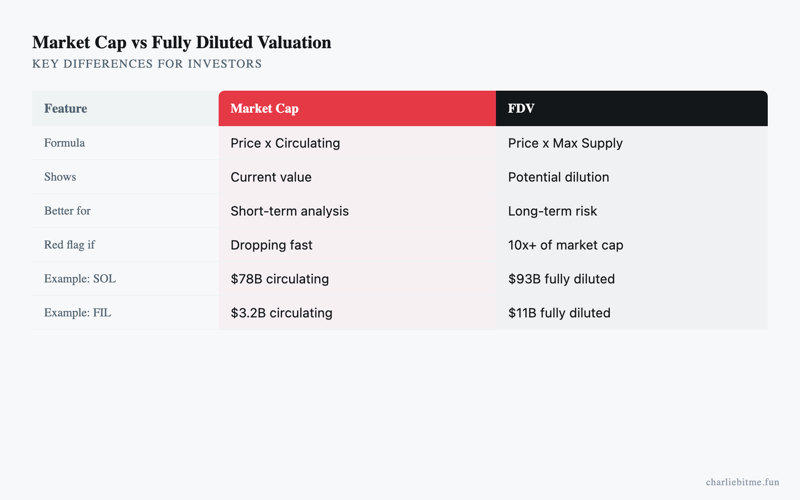
The FDV formula multiplies the current token price by the maximum supply. If a token trades at $5 and has a max supply of 1 billion tokens, the FDV is $5 billion. This is true regardless of whether only 100 million tokens currently circulate. CoinGecko, CoinMarketCap, and Messari all display FDV alongside standard market cap on their token pages.
The distinction between circulating supply and maximum supply is critical. Circulating supply includes only tokens that are freely tradable. Maximum supply includes locked tokens, vesting allocations, treasury reserves, and tokens that have not yet been minted or unlocked. For a deeper understanding of how supply affects valuation, see our guide on cryptocurrency market cap.
Some tokens have no fixed maximum supply. Ethereum, for example, has no hard cap. In those cases, FDV is either listed as undefined or calculated using projected supply over a specific time horizon. This makes FDV comparisons across tokens with different supply models inherently imperfect.
Why Does FDV Matter More Than Market Cap for New Tokens?
FDV matters most for recently launched tokens because they typically have a large gap between circulating supply and total supply. A token might launch with 10% of supply circulating and the remaining 90% locked in vesting schedules for the team, investors, and ecosystem fund. The market cap looks small, but the FDV reveals the true scale of the valuation investors are implicitly accepting.
Consider a real pattern that has repeated across dozens of token launches. A project launches at a $200 million market cap with 8% circulating supply. The FDV is $2.5 billion. Over the next 12-24 months, vesting unlocks flood the market with new supply. Unless demand grows proportionally, the price declines. Early buyers who evaluated the project by market cap alone find themselves holding a depreciating asset.
According to research published by Binance Research, tokens with an FDV-to-market-cap ratio above 10x at launch have historically underperformed tokens with ratios below 5x over the subsequent 12-month period. This pattern held across 100+ token launches analyzed between 2021 and 2024.
| Token | Circulating Supply % | Market Cap | FDV | FDV/MC Ratio | Risk Level |
|---|---|---|---|---|---|
| Bitcoin (BTC) | ~93% | $1.8T+ | ~$1.9T | 1.05x | Low dilution |
| Ethereum (ETH) | 100% (no max cap) | $400B+ | N/A | ~1.0x | Net deflationary |
| Solana (SOL) | ~77% | $80B+ | ~$105B | 1.3x | Moderate |
| Arbitrum (ARB) | ~30% | Variable | 3-4x MC | 3-4x | Significant unlocks ahead |
| Typical new L2 launch | 5-15% | $100-500M | $2-10B | 10-50x | High dilution risk |
What FDV-to-Market-Cap Ratio Is a Red Flag?
An FDV-to-market-cap ratio above 10x warrants serious scrutiny. This ratio means 90% or more of the token supply has not yet entered circulation. Each vesting unlock creates sell pressure as early investors, team members, and ecosystem funds realize their allocations. The token price must absorb this selling without proportional new buying demand.
Ratios between 3x and 10x are common for mid-stage projects and are not automatically disqualifying. The key question is whether the vesting schedule is transparent, whether unlocks are gradual (linear over 2-4 years) or cliff-based (large chunks releasing on specific dates), and whether the project generates enough demand to absorb new supply.
My assessment: any token with an FDV above $5 billion and less than 20% circulating supply is pricing in extraordinary growth assumptions. The project needs to become a top-50 cryptocurrency by actual usage metrics — not just speculative interest — to justify that valuation once fully diluted. Most do not achieve this.
Where Can You Check a Token’s Vesting Schedule?
Token Unlocks (token.unlocks.app) is the most comprehensive free tool for tracking vesting schedules across major projects. It displays unlock dates, amounts, and recipient categories (team, investors, ecosystem, community). CryptoRank and Messari also provide vesting data on their token profile pages.
For tokens not covered by aggregators, check the project’s official documentation. Most legitimate projects publish their tokenomics in a whitepaper, blog post, or governance forum. If a project does not disclose its vesting schedule, that is a red flag in itself. Our research methodology always includes vesting verification as a standard step.
Cross-reference disclosed schedules with on-chain data. Etherscan’s token holder page shows the largest wallets for any ERC-20 token. If team or investor wallets hold percentages inconsistent with the published tokenomics, the discrepancy requires investigation. Tools like Arkham Intelligence and Nansen label known wallets to make this process easier.
How Should FDV Influence Your Investment Decisions?
Use FDV as a ceiling check, not a floor estimate. When you consider buying a token, calculate its FDV and compare it to established projects with similar use cases. If a new DeFi protocol has an FDV of $8 billion but Aave — which has years of track record and billions in total value locked — trades at a similar FDV, the new protocol is priced for perfection before proving itself.
Combine FDV analysis with Bitcoin dominance trends and fundamental research from our cryptocurrency research guide. A token with reasonable FDV in a favorable macro environment (falling BTC dominance, expanding risk appetite) has meaningfully better odds than the same token launched during a dominance uptrend.
Track upcoming unlock events. Large unlocks — typically 5% or more of circulating supply releasing on a single date — create measurable downward pressure. According to data compiled by The Block Research, tokens experience an average 5-10% price decline in the week surrounding major unlock events.
This article is for informational purposes only and does not constitute financial advice. Cryptocurrency investments carry substantial risk. Always conduct your own research and consult a qualified financial advisor before making investment decisions.
Frequently Asked Questions
- Is a high FDV always bad?
- Not automatically. A high FDV with a transparent, gradual vesting schedule and strong product-market fit can be justified. The concern arises when high FDV is paired with low circulating supply and no clear demand driver to absorb future unlocks.
- Does Bitcoin have an FDV?
- Yes. Bitcoin’s FDV is calculated using its maximum supply of 21 million BTC multiplied by the current price. Because over 93% of Bitcoin is already mined, Bitcoin’s FDV is very close to its market cap — a sign of minimal future dilution.
- How do token burns affect FDV?
- Token burns permanently remove tokens from the maximum supply, which directly reduces FDV. Ethereum’s EIP-1559 burn mechanism, for example, has burned millions of ETH since its activation, making ETH periodically deflationary and keeping its effective FDV in check.
- Where can I find FDV data for any token?
- CoinGecko, CoinMarketCap, and Messari display FDV on every token’s profile page alongside circulating market cap, max supply, and total supply. Token Unlocks provides the most detailed vesting schedule data.
Sources
- CoinGecko Token Profiles — FDV and market cap data checked when I last reviewed this article
- Binance Research — token launch performance analysis
- Token Unlocks — vesting schedule tracker
- The Block Research — unlock event price impact data
- Etherscan — on-chain token holder verification