Bitcoin dominance measures Bitcoin’s share of the total cryptocurrency market capitalization. When BTC dominance rises, capital flows into Bitcoin and away from altcoins. When it falls, altcoin markets tend to outperform. Tracking this metric is one of the most reliable ways to time your exposure across the broader crypto market.
In This Article
- How Is Bitcoin Dominance Calculated?
- What Does Rising Bitcoin Dominance Signal for Altcoins?
- What Does Falling Bitcoin Dominance Mean for Altcoin Season?
- Why Does Bitcoin Dominance Matter for Portfolio Decisions?
- What Are the Limitations of Using Bitcoin Dominance?
- How Can You Track Bitcoin Dominance in Real Time?
- Frequently Asked Questions
How Is Bitcoin Dominance Calculated?
Bitcoin dominance is calculated by dividing Bitcoin’s market capitalization by the total market capitalization of all cryptocurrencies, then multiplying by 100. The formula is straightforward: BTC dominance = (BTC market cap / total crypto market cap) x 100. CoinGecko and CoinMarketCap both publish this metric in real time.
When I last checked, Bitcoin’s market cap sat above $1.8 trillion against a total crypto market cap near $3.5 trillion, putting dominance around 55%. This number fluctuates daily as capital rotates between Bitcoin and the thousands of alternative cryptocurrencies trading on centralized and decentralized exchanges.
Understanding how cryptocurrency market cap works is essential context here. Market cap alone does not capture trading volume, liquidity depth, or the proportion of supply that actually circulates. Bitcoin dominance inherits those same blind spots.
What Does Rising Bitcoin Dominance Signal for Altcoins?
Rising BTC dominance signals that investors are rotating capital from altcoins into Bitcoin. This pattern typically emerges during periods of macroeconomic uncertainty, risk-off sentiment, or early-stage bull markets when Bitcoin leads the recovery. Altcoin prices tend to stagnate or decline in relative terms during these phases.
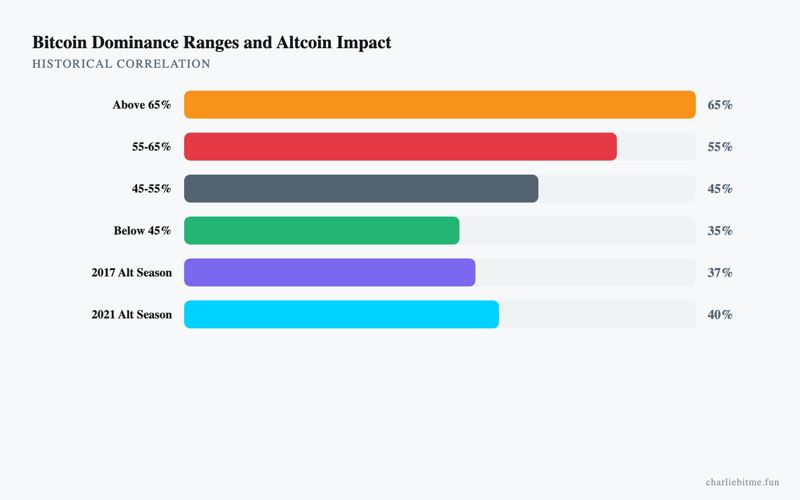
During the bear market of 2022, BTC dominance climbed from roughly 39% to above 48% over twelve months, according to data from TradingView. Smaller-cap tokens lost 70-90% of their value against Bitcoin during that stretch. The pattern repeated in early 2023 as institutional investors favored Bitcoin through spot ETF anticipation while ignoring most altcoins.
A rising dominance environment does not mean altcoins cannot gain in absolute dollar terms. It means Bitcoin is gaining faster. The practical consequence for portfolio allocation is clear: overweighting altcoins during rising dominance periods historically underperforms a simple Bitcoin-only strategy.
What Does Falling Bitcoin Dominance Mean for Altcoin Season?
Falling BTC dominance is the primary quantitative marker of an “altcoin season,” a period when altcoins outperform Bitcoin on a percentage-gain basis. Capital flows outward from Bitcoin into Ethereum, large-cap altcoins, and eventually mid-cap and small-cap tokens. This cascading pattern is sometimes called the “altcoin rotation.”
The Blockchain Center’s Altcoin Season Index defines alt season as a period when 75% of the top 50 altcoins outperform Bitcoin over a rolling 90-day window. BTC dominance typically drops 10-15 percentage points during confirmed alt seasons, based on historical data from CoinGecko covering cycles since 2017.
| Period | BTC Dominance Range | Market Phase | Altcoin Performance |
|---|---|---|---|
| Early 2017 | 85-95% | Pre-ICO boom | Minimal — Bitcoin led |
| Late 2017 – Early 2018 | 35-55% | ICO-driven alt season | Massive outperformance |
| 2019-2020 | 60-70% | Bear recovery | Bitcoin-led recovery |
| Early 2021 | 60-70% | Institutional BTC rally | Lagged Bitcoin initially |
| Mid-Late 2021 | 40-45% | DeFi/NFT alt season | Strong outperformance |
| 2022 | 39-48% | Bear market | Worse than Bitcoin |
| 2023-2024 | 48-57% | ETF-driven BTC rally | Mixed — large caps OK |
Why Does Bitcoin Dominance Matter for Portfolio Decisions?
Bitcoin dominance serves as a macro allocation signal. It tells you where the market’s center of gravity sits. When dominance trends upward, the risk-adjusted return of holding Bitcoin exceeds that of most altcoin baskets. When dominance breaks down, rotating into quality altcoins has historically delivered outsized returns.
This is not a trading indicator with precise entry and exit points. It is a regime indicator. The regime tells you which asset class within crypto deserves the larger allocation. Portfolio managers at firms like Grayscale and Bitwise track dominance as one of their core positioning metrics, according to their published quarterly reports.
My opinion: most retail investors would benefit from a simple rule — maintain at least 50% Bitcoin allocation when dominance is rising, and allow altcoin exposure to increase only when dominance has been declining for at least 30 consecutive days. This avoids premature rotation into altcoins during false breakdowns.
For a deeper framework on evaluating individual altcoins, see our guide on how to research a cryptocurrency before buying. Dominance tells you the macro environment; fundamental research tells you which specific tokens deserve capital within that environment.
What Are the Limitations of Using Bitcoin Dominance?
Bitcoin dominance has real limitations that traders frequently overlook. The metric counts stablecoins — USDT, USDC, DAI, and others — in the total crypto market cap denominator. When stablecoin market caps grow (as they did from $5 billion in early 2020 to over $150 billion by 2024, per DefiLlama data), BTC dominance appears to fall even if no actual rotation into altcoins occurred.
The metric also treats all altcoins equally. A dominance drop caused by Ethereum gaining $50 billion in market cap means something very different from the same drop caused by 500 micro-cap tokens each gaining $100 million. The former reflects institutional demand; the latter often reflects speculative froth.
A more refined approach combines BTC dominance with the ETH/BTC ratio and stablecoin supply data. When BTC dominance falls while the ETH/BTC ratio rises and stablecoin supply contracts, that signals genuine capital rotation into risk assets. When dominance falls but stablecoin supply expands, the signal is ambiguous. Our research methodology explains how we cross-reference these data points.
Understanding fully diluted valuation adds another layer of nuance. Some tokens appear to lower BTC dominance through inflated market caps driven by unreleased supply, distorting the metric further.
How Can You Track Bitcoin Dominance in Real Time?
Several free tools provide live BTC dominance data. CoinGecko displays dominance on its homepage alongside total market cap. TradingView offers a chartable BTC.D ticker with full technical analysis capabilities. CoinMarketCap shows dominance as a percentage in its global metrics header.
For deeper analysis, Glassnode and CryptoQuant provide on-chain variants of dominance that weight by realized cap (capital actually moved on-chain) rather than market cap. Realized cap dominance strips out dormant coins and gives a cleaner picture of active capital flows.
This article is for informational purposes only and does not constitute financial advice. Cryptocurrency investments carry substantial risk. Always conduct your own research and consult a qualified financial advisor before making investment decisions.
Frequently Asked Questions
- What percentage of Bitcoin dominance signals alt season?
- There is no fixed threshold, but historically, alt seasons have begun when BTC dominance drops below 50% and continues declining. The Blockchain Center Altcoin Season Index uses a 90-day rolling comparison of the top 50 altcoins against Bitcoin.
- Does Bitcoin dominance include stablecoins?
- Yes. Most tracking platforms like CoinGecko and CoinMarketCap include stablecoins in the total crypto market cap, which affects the dominance calculation. Some analysts exclude stablecoins for a purer signal.
- Can Bitcoin dominance reach 100% again?
- Technically possible but practically impossible given the size of the Ethereum ecosystem, stablecoin markets, and thousands of active altcoin projects. The last time dominance exceeded 90% was early 2017, before the ICO boom.
- Is Bitcoin dominance a reliable trading signal?
- It works best as a regime indicator for macro allocation rather than a precise trading signal. Combine it with the ETH/BTC ratio, stablecoin flows, and on-chain data for more actionable insights.
Sources
- CoinGecko Global Cryptocurrency Charts — checked when I last reviewed this article
- TradingView BTC Dominance Chart (BTC.D)
- Blockchain Center Altcoin Season Index
- DefiLlama Stablecoin Dashboard
- Glassnode On-Chain Analytics