A candlestick chart displays four price points per time period — open, high, low, and close — in a visual format that reveals buying and selling pressure at a glance. Learning to read candlestick patterns is the foundation of technical analysis for cryptocurrency trading. Each candle tells a story about market sentiment during that interval, and specific formations like doji, hammer, and engulfing patterns signal potential reversals or continuations.
In This Article
- What Are the Parts of a Candlestick?
- Which Candlestick Patterns Signal a Price Reversal?
- Which Patterns Indicate a Trend Will Continue?
- What Timeframe Should Beginners Use for Crypto Charts?
- How Does Volume Confirm Candlestick Patterns?
- What Are the Limitations of Candlestick Analysis for Crypto?
- Frequently Asked Questions
- Sources
What Are the Parts of a Candlestick?
Every candlestick has four data points and two visual components. The rectangular body shows the range between the opening price and closing price. The thin lines above and below — called wicks or shadows — show the highest and lowest prices reached during the period.
A green (or white) candle means the price closed higher than it opened. The bottom of the body is the open, the top is the close. A red (or black) candle means the price closed lower than it opened. The top of the body is the open, the bottom is the close.
| Component | What It Shows | What Traders Watch |
|---|---|---|
| Body (green/bullish) | Price rose from open to close | Larger body = stronger buying pressure |
| Body (red/bearish) | Price fell from open to close | Larger body = stronger selling pressure |
| Upper wick | Highest price reached then rejected | Long upper wick = sellers pushed price back down |
| Lower wick | Lowest price reached then rejected | Long lower wick = buyers absorbed selling pressure |
| No wick (marubozu) | Open or close was the extreme | Maximum conviction — no hesitation from either side |
The time period of each candle depends on your chart settings. A 1-hour chart shows one candle per hour. A daily chart shows one candle per 24-hour trading day. Most crypto exchanges default to a daily view, but short-term traders use 15-minute or 4-hour candles. For a broader view of how prices relate to the overall market, see our guide on cryptocurrency market cap.
Which Candlestick Patterns Signal a Price Reversal?
Reversal patterns suggest the current trend is losing momentum and may change direction. These patterns are most reliable at established support and resistance levels, not in the middle of a range.
Doji
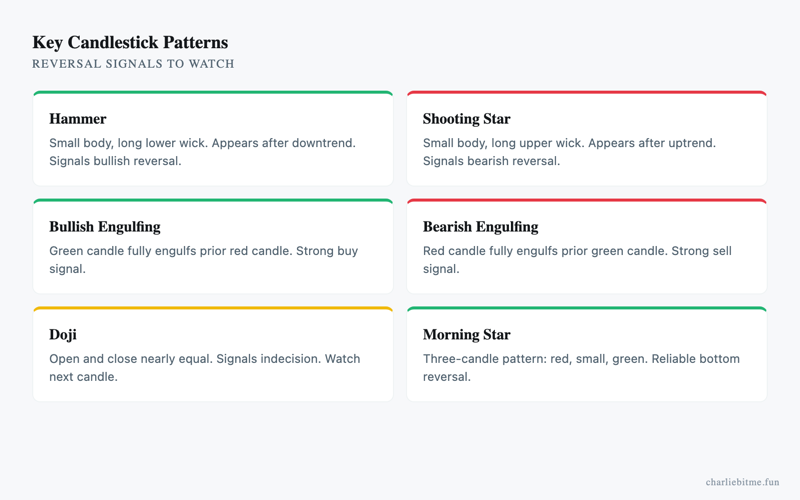
A doji forms when the open and close are nearly identical, creating a cross or plus shape. It signals indecision — neither buyers nor sellers controlled the session. A doji after a strong uptrend warns that buying momentum is fading. A doji after a downtrend suggests sellers are exhausting their pressure.
Doji alone is not a trade signal. Confirmation from the next candle is required. A doji followed by a strong red candle after an uptrend is a bearish reversal signal. A doji followed by a strong green candle after a downtrend is bullish.
Hammer and inverted hammer
A hammer has a small body at the top of the candle and a long lower wick — at least twice the length of the body. It forms during a downtrend and signals that buyers stepped in aggressively after the price dropped. According to technical analysis research compiled by Investopedia, the hammer is one of the most widely recognized bullish reversal patterns.
The inverted hammer has the same implications but flipped — small body at the bottom, long upper wick. It also appears in downtrends and signals potential reversal.
Engulfing patterns
A bullish engulfing pattern occurs when a small red candle is followed by a larger green candle that completely covers (engulfs) the prior candle’s body. The shift from small selling to overwhelming buying pressure suggests a trend reversal. A bearish engulfing is the opposite: a small green candle followed by a larger red candle.
Engulfing patterns carry more weight when they form at key price levels and on higher volume. A bullish engulfing at a known support level with above-average volume is a strong signal.
Which Patterns Indicate a Trend Will Continue?
Continuation patterns confirm that the existing trend has paused but is likely to resume. These are consolidation signals, not reversals.
Three white soldiers: Three consecutive green candles with progressively higher closes. Each candle opens within the prior candle’s body and closes near its high. This pattern after a downtrend signals strong bullish momentum building.
Three black crows: The bearish mirror. Three consecutive red candles with progressively lower closes. Indicates sustained selling pressure.
Rising three methods: A large green candle followed by three small red candles that stay within the first candle’s range, then another large green candle. The small pullbacks did not break the uptrend, confirming buyers remain in control.
What Timeframe Should Beginners Use for Crypto Charts?
The daily timeframe is the best starting point for beginners. It filters out the noise of intraday price fluctuations and produces more reliable patterns. Day-to-day movements on Bitcoin and Ethereum are easier to interpret than 5-minute candles, which generate frequent false signals.
As you develop skill, layer in 4-hour charts for more precise entry and exit timing. The 4-hour timeframe is the workhorse of active crypto traders — detailed enough to time trades, broad enough to avoid noise.
Avoid 1-minute and 5-minute charts until you understand support, resistance, and volume confirmation. Short timeframes amplify randomness. Patterns that look clear on a daily chart dissolve into chaos at the minute level.
For a long-term strategy that avoids timing entirely, see our guide on dollar cost averaging for Bitcoin.
How Does Volume Confirm Candlestick Patterns?
Volume is the number of units traded during a candle’s time period. A candlestick pattern without volume confirmation is unreliable. High volume on a breakout candle means many traders committed capital to the move. Low volume means the move lacks conviction and is more likely to reverse.
According to data from CoinGecko, Bitcoin’s average daily trading volume across major exchanges exceeds $20 billion. Significant deviations from that average — either much higher or much lower — provide context for price movements.
My opinion: volume is the single most underused tool by beginning traders. A hammer candle with three times the average volume is a completely different signal than a hammer on thin volume. Always check volume before acting on any pattern.
For context on how we verify the technical data referenced in this guide, read our research methodology. For broader market context, visit our homepage.
What Are the Limitations of Candlestick Analysis for Crypto?
Candlestick patterns were developed for traditional equity markets with defined trading hours. Crypto markets trade 24/7/365, which means daily candle close times are arbitrary. Different exchanges close their daily candles at different UTC times, producing slightly different patterns.
Crypto markets are also more susceptible to sudden, news-driven moves that invalidate technical patterns. A regulatory announcement, exchange hack, or whale movement can override any technical setup. Patterns work in aggregate over many occurrences — not as guaranteed predictions for any single trade.
False signals are common. According to analysis from TradingView, individual candlestick patterns have accuracy rates between 50% and 65% without additional confirmation factors. Combining pattern recognition with volume, support/resistance, and broader trend context improves reliability significantly.
Frequently Asked Questions
- Do candlestick patterns work for altcoins or only Bitcoin?
- Candlestick patterns work for any asset with sufficient trading volume and liquidity. Bitcoin and Ethereum produce the most reliable patterns due to deep order books. Low-cap altcoins with thin volume generate more false signals because single large orders can paint artificial candles.
- What is the best free tool to view crypto candlestick charts?
- TradingView offers free candlestick charting with technical indicators for all major cryptocurrencies. Most exchanges — including Binance, Coinbase, and Kraken — also provide built-in candlestick charts. TradingView is preferred for its drawing tools and multi-timeframe analysis.
- How many patterns should a beginner learn first?
- Start with five: doji, hammer, engulfing (bullish and bearish), and marubozu. These five cover the most common reversal and momentum signals. Add three white soldiers and morning star after you can reliably identify the first five in live charts.
- Can candlestick patterns predict exact price targets?
- No. Candlestick patterns signal direction and momentum, not magnitude. Price targets require additional tools like Fibonacci retracement levels, moving averages, or measured-move projections. Patterns tell you where price is likely headed; other methods estimate how far.
Sources
- Investopedia — Candlestick Chart Definition and Basics (accessed when I last checked)
- TradingView — Candlestick Charts Documentation (accessed when I last checked)
- CoinGecko — Market Data (accessed when I last checked)
- Binance Academy — Beginner’s Guide to Candlestick Charts (accessed when I last checked)
This article is for informational and educational purposes only. It does not constitute financial or investment advice. Cryptocurrency trading involves substantial risk of loss. Past chart patterns do not guarantee future results.