Crypto market cycles follow a repeating four-phase pattern — accumulation, markup, distribution, and markdown — typically spanning three to four years and closely correlated with Bitcoin halving events. Understanding where the market sits within this cycle helps you make better decisions about when to accumulate, when to take profits, and when to stay patient. This guide breaks down each phase, the on-chain indicators that signal transitions, and what historical cycles tell us about the current market.
In This Article
Market cycle analysis does not predict exact prices or dates. It identifies probabilistic zones where risk and reward shift. If you are building a long-term position, combine cycle awareness with a dollar cost averaging strategy to reduce timing risk.
What Are the Four Phases of a Crypto Market Cycle?
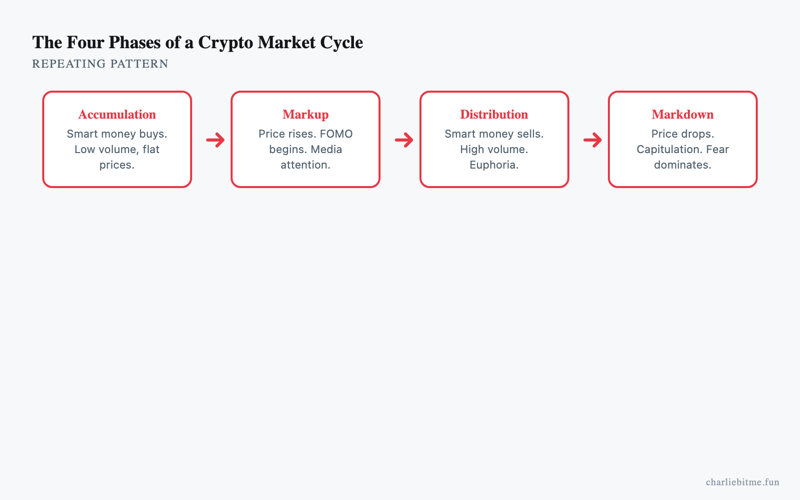
Every crypto cycle moves through accumulation (smart money buys quietly), markup (prices surge and retail enters), distribution (early investors sell to latecomers), and markdown (prices crash and sentiment capitulates). The phases are driven by human psychology and reinforced by the Bitcoin halving’s supply shock.
| Phase | Price Action | Sentiment | Duration | Key Behavior |
|---|---|---|---|---|
| Accumulation | Flat, low volatility | Fear, disbelief, apathy | 12-18 months | Long-term holders buy; retail absent |
| Markup | Sustained uptrend, parabolic late stage | Optimism to euphoria | 12-18 months | Retail enters; media coverage spikes |
| Distribution | Volatile, lower highs | Greed to anxiety | 2-6 months | Early investors sell; retail holds |
| Markdown | Sustained downtrend, capitulation events | Denial to despair | 12-18 months | Forced selling; projects fail |
The markup phase gets all the attention, but the accumulation phase is where the best risk-adjusted entries happen. According to Glassnode’s long-term holder data, wallets that accumulated during bear markets have historically produced the highest returns over the subsequent cycle.
How Does the Bitcoin Halving Affect Market Cycles?
Bitcoin’s halving — which cuts the mining reward in half approximately every four years — has preceded every major bull run in Bitcoin’s history, typically with the cycle peak arriving 12 to 18 months after the halving. The halving reduces new supply entering the market while demand dynamics remain unchanged or increase.
The most recent halving occurred in April 2024, cutting the block reward from 6.25 BTC to 3.125 BTC. According to Blockchain.com historical price data, previous post-halving rallies produced returns of approximately 9,000% (2012), 2,800% (2016), and 700% (2020) from the halving date to the cycle peak.
Each cycle’s percentage return has been smaller than the last. This diminishing-returns pattern is expected as Bitcoin’s market cap grows and it takes more capital to move the price. Expecting a repeat of 2012’s returns is unrealistic. Expecting the halving to matter at all remains reasonable based on the pattern.
Which On-Chain Indicators Signal Cycle Transitions?
The MVRV ratio, long-term holder supply, exchange reserve balances, and the NUPL (Net Unrealized Profit/Loss) metric are the most reliable on-chain signals for identifying where you are in the cycle. No single metric is conclusive, but convergence of several indicators strengthens the signal.
MVRV ratio compares market cap to realized cap (the average cost basis of all coins). Readings above 3.5 have historically coincided with cycle tops. Readings below 1.0 have marked cycle bottoms. When I last checked on CryptoQuant, this metric was one of the most tracked cycle indicators.
Long-term holder supply — the percentage of Bitcoin held by addresses that have not moved coins in over 155 days — rises during accumulation and falls during distribution. When long-term holders begin distributing aggressively, the markup phase is typically nearing its end.
Exchange reserves dropping means investors are moving coins off exchanges into cold storage, indicating accumulation and reducing sell-side pressure. Rising exchange reserves suggest preparation to sell. You can learn more about tracking these metrics in our guide on reading crypto charts and how they complement on-chain analysis.
How Long Do Crypto Cycles Typically Last?
Complete crypto cycles have historically lasted approximately four years from bottom to bottom, aligning with the Bitcoin halving schedule. The 2014-2018 cycle and the 2018-2022 cycle both followed this approximate timeline, though the internal phase durations varied.
The 2022 bear market bottomed around $15,500 for Bitcoin in November 2022. With the April 2024 halving as the supply catalyst, historical patterns would suggest a cycle peak sometime in late 2025 or 2026. However, institutional adoption through spot Bitcoin ETFs — which did not exist in prior cycles — may alter the timing and magnitude.
My opinion: Bitcoin ETF inflows from institutional investors have compressed the volatility bands. The cycle pattern persists, but the extremes on both sides are likely dampened compared to previous cycles. Expecting a 70-80% drawdown in the next bear market, as happened in 2018 and 2022, may be too aggressive if institutional allocations provide a structural floor.
What Mistakes Do People Make When Trading Cycles?
The two most common mistakes are buying in euphoria because it feels safe and selling in despair because it feels rational. Both are emotional responses that produce the worst possible entries and exits. The cycle exploits these instincts perfectly.
During the markup phase, social media fills with success stories. News coverage turns positive. People who swore off crypto during the markdown phase re-enter at much higher prices. At the top, buying feels obvious. At the bottom, buying feels insane. The data consistently shows the opposite action is correct.
Dollar cost averaging — systematically buying a fixed amount on a regular schedule — removes the need to time phases perfectly. Read our latest analysis for current market context. Read about how we evaluate market cycle claims in our research methodology.
Frequently Asked Questions
- Can crypto market cycles break from the four-year pattern?
- Yes. The pattern has held for four cycles, but Bitcoin ETFs, regulatory shifts, and macro factors could extend or compress future cycles. The halving supply shock is mechanical and predictable, but demand is not.
- Do altcoins follow the same cycle as Bitcoin?
- Broadly yes, but with a lag and greater amplitude. Altcoins typically peak weeks to months after Bitcoin and fall harder during the markdown phase. Bitcoin dominance tends to rise early in the markup and late in the markdown.
- Is it too late to invest if the cycle has already started?
- Historically, buying in the first half of the markup phase still produced strong returns. Buying in the distribution phase near the top produced losses. The key is identifying which phase you are in, not whether the cycle has started.
Sources
- Glassnode — Long-Term Holder and MVRV Data — accessed when I last checked
- Blockchain.com Historical Price Data — accessed when I last checked
- CryptoQuant — Exchange Reserves and On-Chain Metrics — accessed when I last checked
- CoinGecko — Bitcoin Market Data — accessed when I last checked
This article is for informational purposes only and does not constitute financial advice. Cryptocurrency investments carry significant risk. Past performance does not guarantee future results. Consult a qualified financial advisor before making investment decisions.